Our results can be categorized as either exploratory or analysis layers. The exploratory layers consist of the socioeconomic variables that have been linked with FSAs. These include a layer of campaign counts per FSA, income, education, and housing (see our interactive web map). The analysis layers consist of the text mining results. These layers consist of ‘geographic wordles’ for the top three terms used in campaign titles and campaign descriptions.
Socioeconomic Variables
In addition to the web map, a table was generated that showed the proportion of crowdfunding campaigns that belonged in each quintile for each socioeconomic variable (see full report for tables and our interactive web map). Only 176 FSAs out of the 1620 FSAs in Canada contained at least one crowdfunding campaign, accounting for about 1.5 million people in terms of population or about 5% of the national total. A separate table was also generated that shows the distribution of the crowdfunding campaigns between each province and territory of Canada and the average value of each socioeconomic variable within each of the administrative divisions (see table below). These tables (which can be viewed in the full report) resulted from a manual process that involved examining the data using ArcGIS 10.5 and placing the information into Microsoft Excel.
Number of Campaigns, Population, and Socioeconomic Values Per Province
|
Province/ |
Number of FSAs |
Number of Campaigns |
Percentage (FSA) |
Percentage (Campaigns) |
Population |
Income, Median After-Tax (Average) |
Education, Post-Secondary (Average) |
Housing, Owner (Average) |
|
British Columbia |
32 |
401 |
18.18% |
22.43% |
268112 |
$28,716.63 |
3728 |
2599 |
|
Alberta |
21 |
310 |
11.93% |
17.34% |
203643 |
$36,012.35 |
3393 |
2846 |
|
Saskatchewan |
14 |
85 |
7.95% |
4.75% |
138065 |
$34,795.72 |
3613 |
3194 |
|
Manitoba |
9 |
66 |
5.11% |
3.69% |
83126 |
$31,275.32 |
3211 |
3032 |
|
Ontario |
47 |
576 |
26.70% |
32.21% |
436637 |
$31,865.32 |
3942 |
3105 |
|
Quebec |
18 |
139 |
10.23% |
7.77% |
158832 |
$30,057.44 |
3923 |
2675 |
|
New Brunswick |
12 |
55 |
6.82% |
3.08% |
75339 |
$26,745.83 |
2287 |
2310 |
|
Nova Scotia |
9 |
69 |
5.11% |
3.86% |
73961 |
$31,392.79 |
3908 |
2425 |
|
Prince Edward Island |
2 |
25 |
1.14% |
1.40% |
15301 |
$27,888.67 |
2984 |
2582 |
|
Newfoundland & Labrador |
9 |
53 |
5.11% |
2.96% |
69103 |
$26,503.28 |
2868 |
2809 |
|
Yukon |
1 |
5 |
0.57% |
0.28% |
16962 |
$41,664.80 |
3278 |
2599 |
|
Northwest Territories |
1 |
3 |
0.57% |
0.17% |
823 |
$51,498.11 |
415 |
228 |
|
Nunavut |
1 |
1 |
0.57% |
0.06% |
3 |
$63.72 |
0 |
0 |
|
Total |
176 |
1788 |
100.00% |
100.00% |
1539908 |
$30,652.31 |
2889 |
2339 |
Text Mining
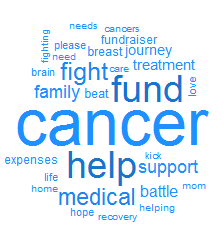
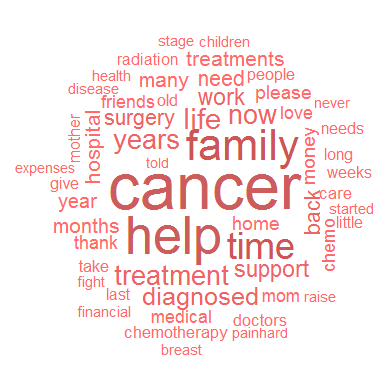
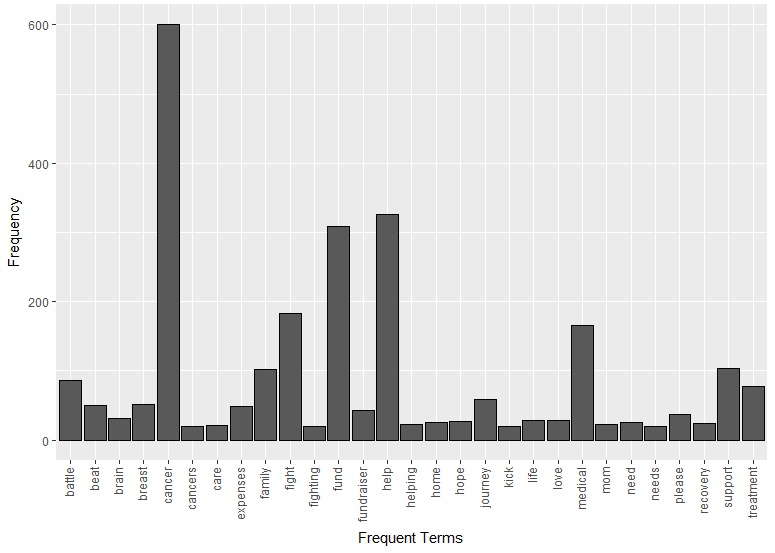
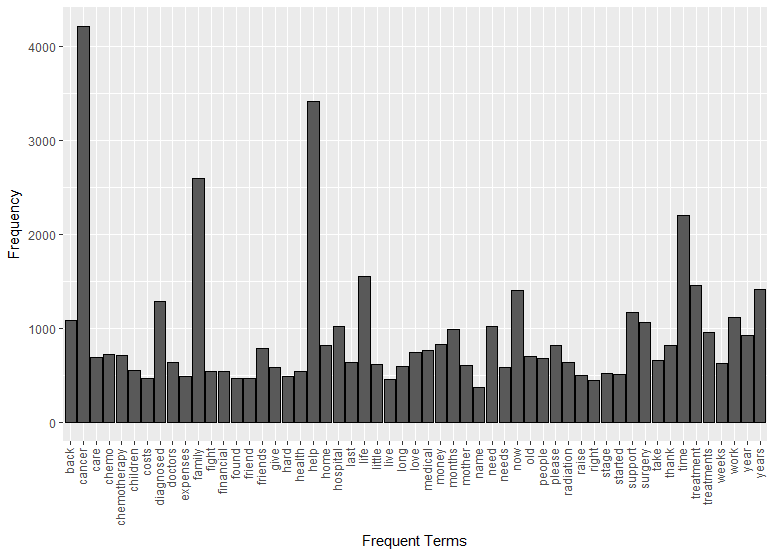
Word clouds were created that denote the most frequent terms for each ADA can be observed within the titles of each respective crowdfunding campaigns and for the description of the campaigns (see below). 'Geographic wordles' were also created to allow for potential discovery of geographic trends pertaining to frequently used terms in campaign titles and descriptions (see our interactive web map). Lastly, bar graphs were created to showcase the most frequent terms used in the campaign titles and campaign descriptions (see below).
Campaign Title Wordle

Campaign Description Wordle

Frequent Terms in Cancer-Related Medical Crowdfunding Campaign Titles

Frequent Terms in Cancer-Related Medical Crowdfunding Campaign Descriptions
